


The diagram represents a simple business process in which a task receives input data, a manual task performs an activity, and the process ends after producing output data. A message boundary event indicates that the manual task can be interrupted or affected by an incoming message.
1. Purpose of the diagram
The process describes this general scenario:
A process starts, receives or uses input data, performs an initial task, then carries out a manual task. The manual task may receive a message while it is in progress. After the task is completed, the process ends and produces output data.
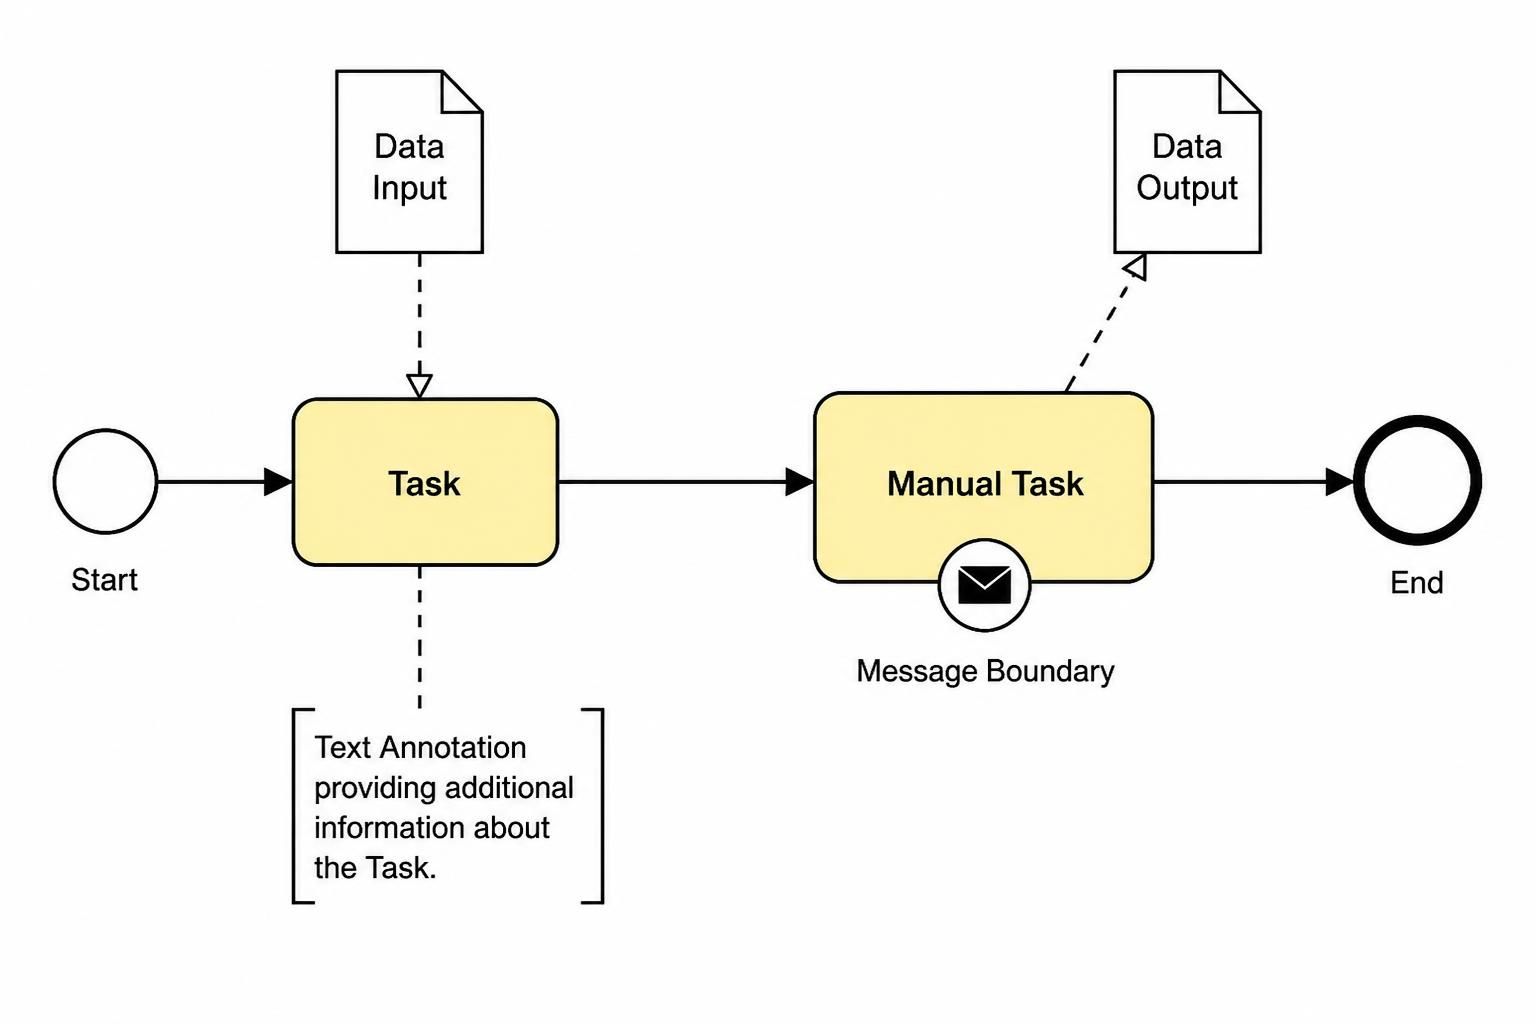
A simplified interpretation is:
Start → Task → Manual Task → End
          ↑          ↑
      Data Input   Message
                       ↓
                  Data Output
More precisely, the data input is associated with the first task, while the data output is associated with the manual task.
2. BPMN elements used
| Diagram element | BPMN notation | Meaning in the example |
|---|---|---|
| Start circle | Start Event | Indicates where the process begins |
| Rounded rectangle labeled “Task” | Task | Represents a general unit of work |
| Rounded rectangle labeled “Manual Task” | Manual Task | Represents work performed by a person without an external BPMN system or application |
| Solid arrow | Sequence Flow | Shows the order in which process activities occur |
| Document icon labeled “Data Input” | Data Input | Represents information available to the process |
| Document icon labeled “Data Output” | Data Output | Represents information produced by the process |
| Dashed arrow to or from data | Data Association | Connects data objects with activities; it does not control process order |
| Envelope symbol attached to a task | Message Boundary Event | Represents a message that can be received while the task is active |
| Text with a connector | Text Annotation | Provides explanatory information without affecting execution |
| Bold black circle | End Event | Indicates that the process path has finished |
3. Reading the process from left to right
Step 1: Start event
The process begins at the circle labeled Start.
The start event indicates the trigger for the process. In this simplified example, the trigger is unspecified. It could represent:
-
A user submitting a request
-
A new order being received
-
A case being created
-
A scheduled process starting
-
A document becoming available
Because the start event has no specific symbol inside it, it is a none start event. This means that the exact trigger is not defined in the diagram.
Step 2: General task
The process moves from the start event to the activity labeled Task.
The solid arrow represents a sequence flow. It shows that the task is performed after the process starts.
A task is a general activity. It does not specify whether the work is performed manually, automatically, or by a particular system.
Examples might include:
-
Review a request
-
Validate information
-
Prepare a record
-
Check submitted details
The diagram uses a generic task because the method of performing the work is not defined.
Step 3: Data input
The Data Input object is connected to the first task using a dashed line with an arrowhead.
This is a data association, not a sequence flow. It indicates that the task uses or receives input information.
Examples of data input could include:
-
A completed application
-
A customer order
-
A request form
-
A source document
-
A set of transaction details
The data input does not mean that the document itself “runs” before the task. Instead, it shows that the task depends on, reads, or consumes that information.
Step 4: Text annotation
The Text Annotation is connected to the task with a dashed annotation connector.
A text annotation is used to add clarification, such as:
-
“Check all required fields”
-
“Use the latest version of the form”
-
“Escalate incomplete requests”
-
“Processing normally takes one business day”
The annotation has no execution effect. Removing it would not change the process flow.
Step 5: Manual task
The process then moves to the activity labeled Manual Task.
A manual task represents work performed by a person outside the control of a business process engine or application.
Examples include:
-
Physically inspecting an item
-
Calling a customer
-
Signing a paper document
-
Packaging a shipment
-
Performing an activity in the real world without system automation
The manual task is connected to the previous task with a solid sequence flow, so it is performed after the first task has been completed.
Step 6: Message boundary event
An envelope symbol is attached to the lower edge of the manual task. This is a message boundary event.
It means that a message may be received while the manual task is being performed. The message could represent:
-
A customer response
-
A cancellation request
-
An approval
-
A status update
-
Additional information
-
A notification from another participant
The envelope indicates a message event. Its position on the task boundary indicates that it is attached to the task and can react while the task is active.
However, the example does not show a sequence flow leaving the boundary event. Therefore, the diagram indicates that a message can be received, but it does not show what happens afterward.
In a complete BPMN model, a boundary event would normally connect to another activity or event, for example:
Manual Task ──→ End
     │
     └─ Message received → Cancel task or process message
Whether the message interrupts the manual task depends on the boundary event type:
-
Interrupting boundary event: The manual task stops when the message is received.
-
Non-interrupting boundary event: The manual task continues, while an additional process path is started.
The standard interrupting message boundary event is commonly shown with a solid event border, while a non-interrupting event uses a dashed border.
Step 7: Data output
The Data Output object is connected to the manual task by a dashed data association.
This indicates that the manual task produces or makes available output information.
Examples include:
-
A completed inspection report
-
An approved request
-
A signed document
-
A shipment confirmation
-
A completed service record
The data output does not determine the next process step. It describes the information generated by the activity.
Step 8: End event
After the manual task is completed, the solid sequence flow continues to the bold black circle labeled End.
This is a none end event. It indicates that this process path has finished.
The end event does not necessarily mean that the entire organization has stopped working. It means only that the modeled process instance or path has reached its defined conclusion.
4. Sequence flow versus data association
One of the most important distinctions in the diagram is the difference between solid and dashed connectors.
Sequence flow
The solid arrows show control flow:
Start → Task → Manual Task → End
They answer:
What happens next?
Sequence flow connects events, activities, and gateways within the same process.
Data association
The dashed arrows connect activities to data objects:
Data Input - - -→ Task
Manual Task - - -→ Data Output
They answer:
What information does the activity use or produce?
A data association does not determine the order of execution. The process does not move from the data input directly to the task because of the dashed line; rather, the dashed line documents the relationship between the task and the data.
5. Core BPMN concepts demonstrated
Events
Events represent something that happens during a process.
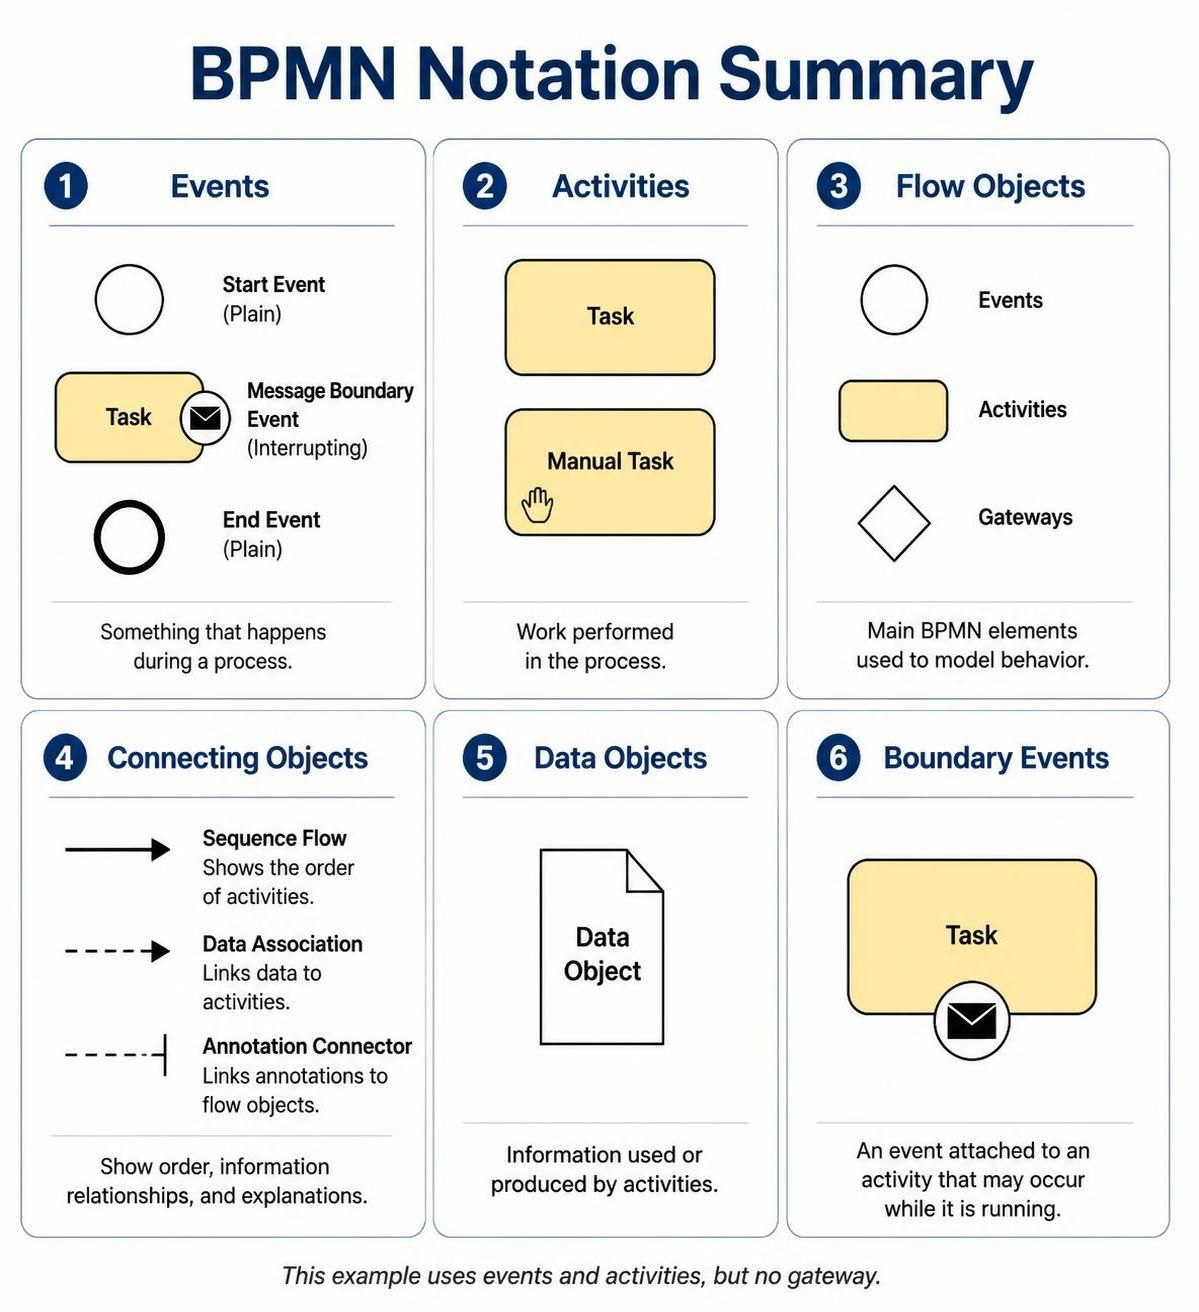
The diagram contains:
-
A start event
-
A message boundary event
-
An end event
Events are different from tasks because they represent occurrences or triggers rather than work being performed.
Activities
Activities represent work.
The diagram contains:
-
One general task
-
One manual task
A manual task is a specialized type of task that explicitly identifies human, non-automated work.
Flow objects
The main BPMN flow objects are:
-
Events
-
Activities
-
Gateways
This diagram uses events and activities but does not contain a gateway.
Connecting objects
The diagram uses:
-
Sequence flow for process order
-
Data associations for information relationships
-
An annotation connector for explanatory text
Data objects
Data objects represent information used or produced during the process. They describe the information perspective of the process without becoming process activities themselves.
Boundary events
A boundary event is attached to the boundary of an activity. It allows the model to show an event that may occur while the activity is running.
6. Complete interpretation in plain language
A suitable business interpretation of the diagram is:
When the process starts, an input document or data set is made available to a general task. The task processes the input and then passes control to a manual activity. While the manual activity is in progress, an external message may be received. Once the manual activity is completed, it produces an output document or data set, and the process ends.
The text annotation adds explanatory information about the first task but does not affect the process execution.
7. What the diagram does not specify
The diagram is intentionally simple and leaves several details undefined:
-
What specifically triggers the start event
-
What the general task actually does
-
What the input data contains
-
What the manual task involves
-
What message may be received
-
Whether the message interrupts the manual task
-
What happens after the message is received
-
What the output data contains
-
Whether errors or exceptions are possible
-
Whether the process can repeat
-
Whether multiple participants or departments are involved
These details could be added in a more complete BPMN model.
8. Example business scenario
-
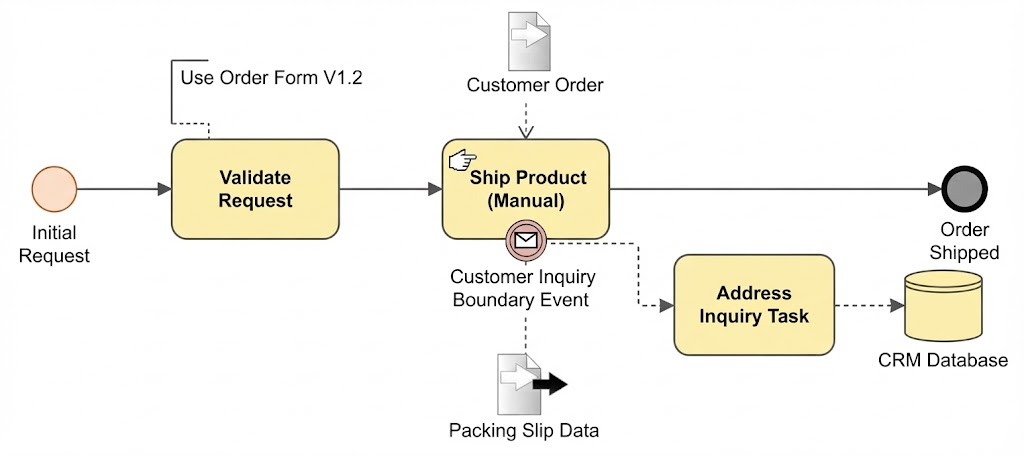
Here is an interpretation of the BPMN process diagram example provided:
-
Process Initiation: The process begins with an Initial Request start event.
-
Validation Step: The workflow moves via a sequence flow to the Validate Request task, which is guided by a Text Annotation specifying to “Use Order Form V1.2”.
-
Fulfillment and Data Association: From validation, the process flows to the Ship Product (Manual) task. This manual task is associated with a Customer Order data input and produces Packing Slip Data as a data output.
-
Exception Handling: While the manual shipment task is active, a Customer Inquiry Boundary Event (represented by a message icon) can trigger an alternative path to an Address Inquiry Task, which then logs details into the CRM Database.
-
Process Completion: Once the main product shipment completes successfully, the workflow terminates at the Order Shipped end event.
-
9. Key lessons from the example
-
Use solid sequence flows to show the order of process activities.
-
Use dashed data associations to show information used or produced.
-
Use a manual task when a person performs work outside automated system control.
-
Use a message boundary event when a message can arrive while an activity is running.
-
Use text annotations to explain a process without changing its behavior.
-
Use start and end events to define the boundaries of the process.
-
Always connect a boundary event to a follow-up flow if the model needs to show what happens after the event occurs.
-
Data objects describe information; they do not replace process activities or sequence flow.
The diagram is therefore a basic BPMN example showing the relationship between process control flow, human work, incoming messages, explanatory notes, and process data.
-
Comprehensive Guide to BPMN, Visual Paradigm Tooling, AI, and Ecosystem: Official blog post outlining the four pillars of the VP AI ecosystem with practical BPMN examples like Employee Onboarding and Order Fulfillment .
-
Mastering Business Process Modeling: A Complete Guide to BPMN and AI-Powered Diagram Generation: Official guide detailing how to use the AI Business Process Diagram generator, with step-by-step instructions and feature comparisons .
-
From Text to Process Flow: My Hands-On Review of Visual Paradigm’s AI-Powered BPMN Generator: Independent review testing the generator across real-world scenarios (e-commerce, IT support, banking) from a business analyst perspective .
-
AI BPMN Diagram Generator: Professional BPD Tool: Official product page explaining the text-to-diagram feature, how to access it in VP Desktop, and key benefits like standard compliance .
-
BPMN、Visual Paradigm 工具、人工智能与生态系统全面指南: Chinese version of the comprehensive guide, covering BPMN fundamentals and AI-driven generation case studies .
-
From Text to Process Flow: A Hands-On Review of Visual Paradigm’s AI-Powered BPMN Generator: Detailed case study on a hardware retailer’s shipment process, demonstrating how AI handles gateways, parallel execution, and swimlane logic .
-
AI BPMN图生成器:专业BPD工具: Chinese product guide detailing the AI generator’s capabilities, including automatic pool and lane inclusion for cross-functional clarity .
-
我的亲身体验:利用 Visual Paradigm 的 AI 驱动 BPMN 改变工作流程文档: First-hand review of the AI generator’s performance on employee onboarding, customer support, and loan approval scenarios .
-
BPMN 2.0 商业流程建模新手实战指南:运用 Visual Paradigm 与 AI 轻松打造专业流程图: Practical tutorial with prompt writing strategies and advanced optimization techniques using the AI Chatbot for conversational refinement .
-
BPMN 完整实战教程:Visual Paradigm 体验、AI 功能与生态系统深度指南: Series of articles covering the AI-powered BPMN generator launch, with deep dives into ecosystem integration and practical examples .
Related posts:
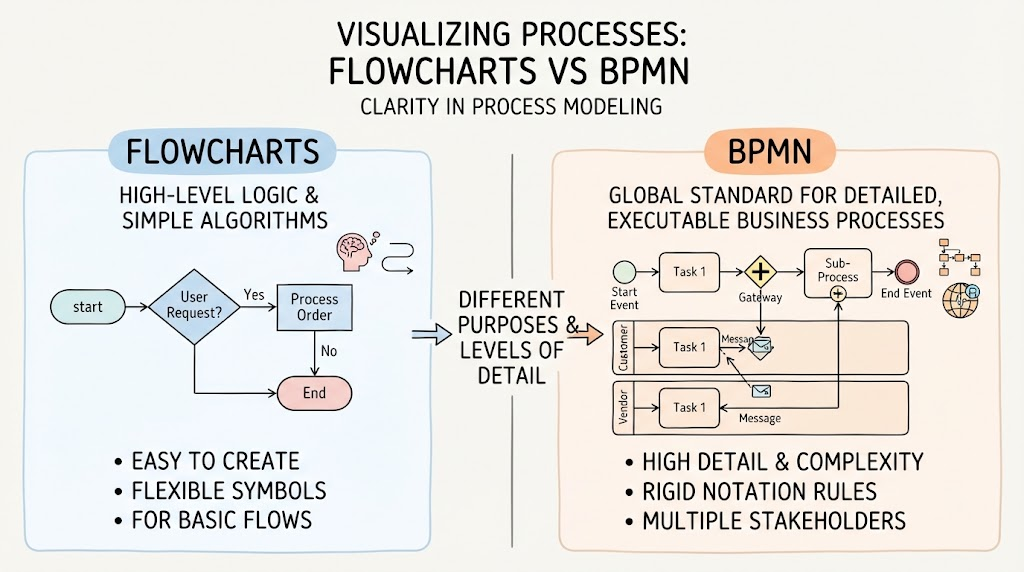 BPMN vs. Flowcharts: Understanding the Key Differences and When to Use Each
 From Process to Product: Translating BPMN Diagrams into Agile User Stories
 Taming Spaghetti Diagrams: AI-Assisted Refactoring for Cleaner BPMN Architecture
Mastering BPMN Intermediate Events: A Practical Guide Using Visual Paradigm
Taming Spaghetti Diagrams: AI-Assisted Refactoring for Cleaner BPMN Architecture
Mastering BPMN Intermediate Events: A Practical Guide Using Visual Paradigm